On Average, since our
inception in 1999, we have correctly projected the fantasy direction
on approximately 75% of the players.
Last season, our software ranked RB Latavius Murray (7
rounds ahead of his ADP), TE Zach Ertz, RB Kareem Hunt (3
rounds ahead), QB Russell Wilson and Cam Newton (2
rounds ahead). WR Golden Tate (2 rounds ahead), WR
Tyreek Hill (1 round ahead), WR DaVante Adams (1 round
ahead), WR Doug Baldwin (1 round ahead), TE Travis Kelce
(1 round ahead), Leonard Fournette (1 round ahead).
These are just a few
examples of the many calls we made in 2017.
These
are just a few examples of the many calls that helped subscribers
win a championship in 2017.
The analysis below
measures fantasy points per game for the designated period. The
focus of this analysis is to measure our ability in forecasting
whether a player would have a better or worse fantasy season than
the previous year. It
assumes a generic fantasy scoring league (1 point for 10 yards
rush/receiving, 1 point for 20 yards passing, 6 points for
rushing/receiving TD, 4 points for passing TD) We use Points per
Game as it doesn't penalize for factors such as injuries which would be out of a
prognosticator's control.
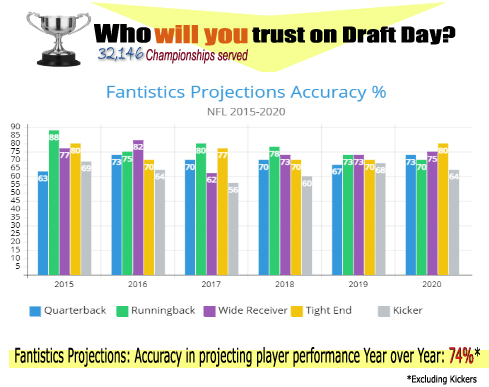
2017: Preseason Projections vs Year End Results*
Quarterbacks:
21 out of
the top 30 = 70% correct
Running Backs:
32 out of
top 40 = 80% correct
Wide Receivers:
37 out
of top 60 = 62% correct
Tight Ends:
23 out of
top 30 = 77% correct
Place Kickers:
13 out of the top 25 = 56% correct
*Based on predicting whether or not
a player would have a better or worse fantasy season. For a detailed
listing of each player and position. Previous Years:
16/15/14/13/12/11/10/09/08/07/06/05/04/03/02
A look back: 2017 Quarterback Projections -
70 % Success
|
|
2015 |
2016 |
2016 |
Projection |
|
Player |
Actual |
Projection |
Expected |
Actual |
Result |
Direction |
|
Wilson,Ru |
19.5 |
22.0 |
UP |
24.4 |
UP |
 |
|
Brady,To |
18.3 |
23.2 |
UP |
21.5 |
UP |
|
|
Smith,Al |
17.5 |
15.6 |
DOWN |
22.5 |
UP |
 |
|
Newton,Ca |
19.3 |
21.7 |
UP |
20.8 |
UP |
|
|
Cousins,Ki |
22.3 |
20.5 |
DOWN |
20.6 |
DOWN |
|
|
Stafford,Ma |
20.3 |
20.7 |
UP |
20.5 |
UP |
|
|
Rivers,Ph |
19.6 |
18.6 |
DOWN |
19.8 |
UP |
|
|
Wentz,Ca |
15.8 |
23.5 |
UP |
24.1 |
UP |
|
|
Brees,Dr |
24.5 |
22.3 |
DOWN |
19.1 |
DOWN |
|
|
Roethlisberger,Be |
20.6 |
22.1 |
UP |
20.1 |
DOWN |
|
|
Prescott,Da |
4.0 |
21.3 |
UP |
18.7 |
UP |
|
|
Goff,Ja |
5.2 |
15.4 |
UP |
20.0 |
UP |
|
|
Bortles,Bl |
19.8 |
17.2 |
DOWN |
17.9 |
DOWN |
|
|
Ryan,Ma |
24.8 |
21.8 |
DOWN |
17.2 |
DOWN |
|
|
Keenum,Ca |
10.4 |
2.4 |
DOWN |
17.1 |
UP |
|
|
Taylor,Ty |
20.1 |
19.1 |
DOWN |
17.0 |
DOWN |
|
|
Dalton,An |
19.3 |
19.7 |
UP |
15.7 |
DOWN |
|
|
Winston,Ja |
18.9 |
25.9 |
UP |
19.1 |
UP |
|
|
Mariota,Ma |
20.3 |
23.0 |
UP |
16.3 |
DOWN |
|
|
Carr,De |
20.3 |
22.6 |
UP |
16.2 |
DOWN |
|
|
McCown,Jo |
11.5 |
11.6 |
UP |
18.7 |
UP |
|
|
Manning,El |
17.0 |
18.1 |
UP |
14.5 |
DOWN |
|
|
Flacco,Jo |
17.7 |
16.5 |
DOWN |
13.4 |
DOWN |
|
|
Cutler,Ja |
12.2 |
19.7 |
UP |
13.2 |
UP |
|
|
Siemian,Tr |
16.3 |
15.3 |
DOWN |
11.8 |
DOWN |
|
|
Rodgers,Aa |
26.8 |
56.2 |
UP |
21.2 |
DOWN |
|
|
Hundley,Br |
-0.1 |
0.0 |
UP |
9.0 |
UP |
|
|
Fitzpatrick,Ry |
10.8 |
1.0 |
DOWN |
6.1 |
DOWN |
|
|
Savage,To |
2.0 |
10.7 |
UP |
6.1 |
UP |
|
|
Hoyer,Br |
13.7 |
11.9 |
DOWN |
4.9 |
DOWN |
|
A look back: 2017 Running Back Projections -
80 % Success
|
|
2016 |
2017 |
2017 |
Projection |
|
Player |
Actual |
Projection |
Expected |
Actual |
Result |
Direction |
|
Gurley,To |
12.5 |
15.2 |
UP |
25.8 |
UP |
|
|
Bell,Le |
21.1 |
21.4 |
UP |
23.1 |
UP |
|
|
Gordon,Me |
19.6 |
16.5 |
DOWN |
18.0 |
DOWN |
|
|
Ingram,Ma |
15.1 |
11.3 |
DOWN |
17.8 |
UP |
|
|
McCoy,Le |
19.8 |
16.2 |
DOWN |
16.6 |
DOWN |
|
|
Elliott,Ez |
20.4 |
20.7 |
UP |
20.5 |
UP |
|
|
Howard,Jo |
14.5 |
16.0 |
UP |
12.6 |
DOWN |
|
|
Hyde,Ca |
15.1 |
13.6 |
DOWN |
14.8 |
DOWN |
|
|
Freeman,De |
17.9 |
16.7 |
DOWN |
14.4 |
DOWN |
|
|
Lewis,Di |
5.0 |
8.9 |
UP |
12.3 |
UP |
|
|
Miller,La |
13.8 |
12.2 |
DOWN |
12.1 |
DOWN |
|
|
Collins,Al |
3.2 |
1.1 |
DOWN |
11.7 |
UP |
|
|
Anderson,CJ |
14.7 |
11.5 |
DOWN |
10.9 |
DOWN |
|
|
Johnson,Du |
9.2 |
11.1 |
UP |
13.8 |
UP |
|
|
Gore,Fr |
13.5 |
11.0 |
DOWN |
10.9 |
DOWN |
|
|
Murray,La |
15.0 |
10.0 |
DOWN |
9.8 |
DOWN |
|
|
Coleman,Te |
14.7 |
11.5 |
DOWN |
11.2 |
DOWN |
|
|
Murray,De |
18.2 |
15.5 |
DOWN |
11.6 |
DOWN |
|
|
McKinnon,Je |
9.7 |
4.6 |
DOWN |
11.3 |
UP |
|
|
Powell,Bi |
12.4 |
13.1 |
UP |
9.8 |
DOWN |
|
|
Henry,De |
7.1 |
9.5 |
UP |
8.4 |
UP |
|
|
Allen,Ja |
1.0 |
0.5 |
DOWN |
10.4 |
UP |
|
|
Darkwa,Or |
2.6 |
5.5 |
UP |
9.1 |
UP |
|
|
Thompson,Ch |
9.4 |
7.9 |
DOWN |
15.5 |
UP |
|
|
Crowell,Is |
13.0 |
12.0 |
DOWN |
9.0 |
DOWN |
|
|
Stewart,Jo |
11.5 |
8.5 |
DOWN |
8.2 |
DOWN |
|
|
Ajayi,Ja |
14.5 |
14.3 |
DOWN |
9.9 |
DOWN |
|
|
Drake,Ke |
2.8 |
4.1 |
UP |
9.0 |
UP |
|
|
Bernard,Gi |
12.4 |
8.9 |
DOWN |
9.5 |
DOWN |
|
|
Riddick,Th |
16.2 |
9.9 |
DOWN |
9.8 |
DOWN |
|
|
Abdullah,Am |
6.8 |
11.7 |
UP |
9.0 |
UP |
|
|
Burkhead,Re |
4.9 |
7.6 |
UP |
13.0 |
UP |
|
|
Blount,Le |
14.7 |
10.8 |
DOWN |
6.8 |
DOWN |
|
|
Forte,Ma |
13.3 |
9.2 |
DOWN |
10.3 |
DOWN |
|
|
White,Ja |
10.1 |
8.5 |
DOWN |
9.6 |
DOWN |
|
|
Peterson,Ad |
2.2 |
10.9 |
UP |
8.3 |
UP |
|
|
Barber,Pe |
2.4 |
4.1 |
UP |
5.5 |
UP |
|
|
Gillislee,Mi |
8.4 |
11.9 |
UP |
7.9 |
DOWN |
|
|
Montgomery,Ty |
9.5 |
13.9 |
UP |
11.5 |
UP |
|
|
Ivory,Ch |
9.2 |
4.0 |
DOWN |
5.9 |
DOWN |
|
|
Morris,Al |
2.9 |
5.4 |
UP |
4.8 |
UP |
|
A look back: 2017
Wide Receiver Projections - 62 % Success
|
|
2016 |
2017 |
2017 |
Projection |
|
Player |
Actual |
Projection |
Expected |
Actual |
Result |
Direction |
|
Hopkins,De |
12.3 |
16.9 |
UP |
20.8 |
UP |
|
|
Brown,An |
20.5 |
23.1 |
UP |
22.0 |
UP |
|
|
Allen,Ke |
3.0 |
14.4 |
UP |
17.8 |
UP |
|
|
Hill,Ty |
12.6 |
15.1 |
UP |
16.1 |
UP |
|
|
Jones,Ma |
11.5 |
11.7 |
UP |
14.1 |
UP |
|
|
Jones,Ju |
18.6 |
19.4 |
UP |
15.8 |
DOWN |
|
|
Green,AJ |
18.6 |
17.2 |
DOWN |
14.4 |
DOWN |
|
|
Thomas,Mi |
17.3 |
16.8 |
DOWN |
16.2 |
DOWN |
|
|
Cooks,Br |
15.4 |
16.5 |
UP |
13.7 |
DOWN |
|
|
Thielen,Ad |
12.3 |
12.8 |
UP |
15.3 |
UP |
|
|
Fitzgerald,La |
15.4 |
13.8 |
DOWN |
16.3 |
UP |
|
|
Landry,Ja |
14.6 |
12.8 |
DOWN |
16.5 |
UP |
|
|
Adams,Da |
15.4 |
17.3 |
UP |
15.9 |
UP |
|
|
Baldwin,Do |
15.6 |
16.4 |
UP |
13.8 |
DOWN |
|
|
Anderson,Ro |
7.3 |
9.4 |
UP |
12.5 |
UP |
|
|
Diggs,St |
13.8 |
15.1 |
UP |
14.1 |
UP |
|
|
Jeffery,Al |
12.2 |
14.0 |
UP |
11.9 |
DOWN |
|
|
Tate,Go |
13.9 |
14.1 |
UP |
14.1 |
UP |
|
|
Funchess,De |
5.6 |
8.2 |
UP |
12.2 |
UP |
|
|
Agholor,Ne |
5.7 |
9.8 |
UP |
12.1 |
UP |
|
|
Crowder,Ja |
12.1 |
12.8 |
UP |
12.1 |
DOWN |
|
|
Evans,Mi |
18.8 |
18.8 |
UP |
13.4 |
DOWN |
|
|
Thomas,De |
14.3 |
15.2 |
UP |
13.0 |
DOWN |
|
|
Stills,Ke |
10.6 |
9.4 |
DOWN |
11.2 |
UP |
|
|
Hilton,TY |
17.0 |
15.8 |
DOWN |
11.1 |
DOWN |
|
|
Bryant,De |
13.7 |
15.2 |
UP |
11.8 |
DOWN |
|
|
Goodwin,Ma |
6.0 |
6.8 |
UP |
10.6 |
UP |
|
|
Kearse,Je |
6.1 |
9.6 |
UP |
11.0 |
UP |
|
|
Cooper,Am |
14.2 |
18.2 |
UP |
11.3 |
DOWN |
|
|
Crabtree,Mi |
14.8 |
15.7 |
UP |
12.0 |
DOWN |
|
|
Woods,Ro |
9.2 |
14.4 |
UP |
13.8 |
UP |
|
|
Sanu,Mo |
9.9 |
10.7 |
UP |
11.2 |
UP |
|
|
Watkins,Sa |
9.2 |
14.3 |
UP |
9.7 |
UP |
|
|
Ginn,Te |
10.2 |
11.4 |
UP |
10.7 |
UP |
|
|
Richardson,Pa |
3.7 |
6.0 |
UP |
10.0 |
UP |
|
|
Matthews,Ri |
13.4 |
14.8 |
UP |
11.1 |
DOWN |
|
|
Wallace,Mi |
12.6 |
13.2 |
UP |
10.1 |
DOWN |
|
|
Williams,Ty |
13.6 |
12.1 |
DOWN |
8.8 |
DOWN |
|
|
Cobb,Ra |
11.4 |
13.8 |
UP |
10.5 |
DOWN |
|
|
Benjamin,Tr |
9.9 |
6.6 |
DOWN |
7.8 |
DOWN |
|
|
Lee,Ma |
10.6 |
10.9 |
UP |
10.4 |
DOWN |
|
|
Jackson,De |
12.1 |
11.4 |
DOWN |
9.9 |
DOWN |
|
|
Benjamin,Ke |
12.4 |
16.0 |
UP |
9.6 |
DOWN |
|
|
Shepard,St |
11.5 |
15.8 |
UP |
13.2 |
UP |
|
|
Fuller,Wi |
8.1 |
15.3 |
UP |
11.3 |
UP |
|
|
Doctson,Jo |
4.5 |
12.1 |
UP |
7.5 |
UP |
|
|
Nelson,Jo |
19.2 |
18.7 |
DOWN |
9.1 |
DOWN |
|
|
Grant,Ry |
1.1 |
0.8 |
DOWN |
7.9 |
UP |
|
|
Amendola,Da |
6.0 |
12.0 |
UP |
9.3 |
UP |
|
|
Hogan,Ch |
8.7 |
20.6 |
UP |
12.2 |
UP |
|
|
Wilson,Al |
5.1 |
5.1 |
DOWN |
8.9 |
UP |
|
|
Lockett,Ty |
8.3 |
11.1 |
UP |
7.4 |
DOWN |
|
|
Parker,De |
10.3 |
17.6 |
UP |
10.0 |
DOWN |
|
|
LaFell,Br |
11.6 |
7.6 |
DOWN |
7.8 |
DOWN |
|
|
Brown,Ja |
5.1 |
5.7 |
UP |
6.4 |
UP |
|
|
Humphries,Ad |
8.7 |
7.5 |
DOWN |
8.2 |
DOWN |
|
|
Thompson,De |
3.7 |
4.3 |
UP |
6.6 |
UP |
|
|
Decker,Er |
13.3 |
10.5 |
DOWN |
7.3 |
DOWN |
|
|
Hurns,Al |
9.2 |
15.3 |
UP |
9.9 |
UP |
|
|
Williams,Te |
7.9 |
8.6 |
UP |
6.9 |
DOWN |
|
A look back: 2017
Tight End Projections - 77 % Success
|
|
2016 |
2017 |
2017 |
Projection |
|
Player |
Actual |
Projection |
Expected |
Actual |
Result |
Direction |
|
Gronkowski,Ro |
12.1 |
14.8 |
UP |
17.3 |
UP |
|
|
Kelce,Tr |
13.7 |
13.8 |
UP |
15.7 |
UP |
|
|
Ertz,Za |
13.1 |
11.9 |
DOWN |
14.6 |
UP |
|
|
Graham,Ji |
12.1 |
12.2 |
UP |
10.6 |
DOWN |
|
|
Davis,Ve |
7.1 |
6.5 |
DOWN |
8.8 |
UP |
|
|
Walker,De |
12.5 |
12.0 |
DOWN |
11.2 |
DOWN |
|
|
Rudolph,Ky |
13.1 |
11.9 |
DOWN |
9.9 |
DOWN |
|
|
Brate,Ca |
11.4 |
8.7 |
DOWN |
8.9 |
DOWN |
|
|
Doyle,Ja |
9.2 |
9.8 |
UP |
11.5 |
UP |
|
|
Witten,Ja |
9.6 |
9.0 |
DOWN |
9.3 |
DOWN |
|
|
Kroft,Ty |
1.4 |
3.4 |
UP |
7.8 |
UP |
|
|
Henry,Hu |
8.8 |
10.0 |
UP |
9.8 |
UP |
|
|
Ebron,Er |
11.1 |
10.5 |
DOWN |
8.4 |
DOWN |
|
|
Cook,Ja |
7.4 |
7.8 |
UP |
8.4 |
UP |
|
|
Watson,Be |
0.0 |
7.0 |
UP |
8.6 |
UP |
|
|
Hooper,Au |
4.6 |
9.3 |
UP |
7.5 |
UP |
|
|
Clay,Ch |
9.1 |
8.0 |
DOWN |
9.0 |
DOWN |
|
|
Lewis,Ma |
4.3 |
4.9 |
UP |
5.4 |
UP |
|
|
Celek,Ga |
5.1 |
4.2 |
DOWN |
4.9 |
DOWN |
|
|
Thomas,Ju |
9.1 |
9.4 |
UP |
7.0 |
DOWN |
|
|
James,Je |
5.7 |
8.5 |
UP |
6.1 |
UP |
|
|
Burton,Tr |
5.1 |
4.5 |
DOWN |
5.2 |
UP |
|
|
Dickson,Ed |
1.8 |
2.4 |
UP |
5.0 |
UP |
|
|
Gates,An |
10.7 |
8.1 |
DOWN |
5.0 |
DOWN |
|
|
DeValve,Se |
3.2 |
2.6 |
DOWN |
5.3 |
UP |
|
|
O'Leary,Ni |
1.3 |
1.6 |
UP |
4.4 |
UP |
|
|
Anderson,St |
2.0 |
2.3 |
UP |
4.6 |
UP |
|
|
Willson,Lu |
3.3 |
3.3 |
DOWN |
3.6 |
UP |
|
|
Miller,Za |
12.0 |
8.8 |
DOWN |
7.0 |
DOWN |
|
|
Higbee,Ty |
1.6 |
5.3 |
UP |
4.1 |
UP |
|
A look back: 2016
Kicker Projections - 56 % Success
|
|
2016 |
2017 |
2017 |
Projection |
|
Player |
Actual |
Projection |
Expected |
Actual |
Result |
Direction |
|
Zuerlein,Gr. |
5.2 |
8.7 |
UP |
13.0 |
UP |
|
|
Gould,Ro. |
5.4 |
7.4 |
UP |
10.0 |
UP |
|
|
Gostkowski,St. |
7.8 |
10.3 |
UP |
9.9 |
UP |
|
|
Boswell,Ch. |
7.3 |
9.4 |
UP |
9.6 |
UP |
|
|
Tucker,Ju. |
10.6 |
11.2 |
UP |
9.1 |
DOWN |
|
|
Prater,Ma. |
8.2 |
9.8 |
UP |
8.9 |
UP |
|
|
Forbath,Ka. |
9.8 |
9.1 |
DOWN |
8.6 |
DOWN |
|
|
Succop,Ry. |
7.4 |
9.7 |
UP |
8.6 |
UP |
|
|
Bryant,Ma. |
10.5 |
9.9 |
DOWN |
8.6 |
DOWN |
|
|
Gano,Gr. |
8.8 |
9.4 |
UP |
7.4 |
DOWN |
|
|
Hauschka,St. |
7.9 |
9.3 |
UP |
7.3 |
DOWN |
|
|
Dawson,Ph. |
5.6 |
9.6 |
UP |
7.3 |
UP |
|
|
Catanzaro,Ch. |
7.2 |
7.8 |
UP |
7.1 |
DOWN |
|
|
Vinatieri,Ad. |
8.8 |
9.6 |
UP |
6.7 |
DOWN |
|
|
Walsh,Bl. |
6.3 |
9.7 |
UP |
6.5 |
UP |
|
|
McManus,Br. |
7.8 |
9.5 |
UP |
6.4 |
DOWN |
|
|
Crosby,Ma. |
8.1 |
10.4 |
UP |
5.0 |
DOWN |
|
|
Bullock,Ra. |
5.2 |
8.2 |
UP |
4.9 |
DOWN |
|
|
Parkey,Co. |
6.4 |
9.3 |
UP |
4.8 |
DOWN |
|
|
Bailey,Da. |
8.6 |
13.3 |
UP |
5.4 |
DOWN |
|
|
Barth,Co. |
5.4 |
11.5 |
UP |
5.7 |
UP |
|
|
Myers,Ja. |
8.1 |
25.0 |
UP |
8.8 |
UP |
|
|
Nugent,Mi. |
6.5 |
4.7 |
DOWN |
6.1 |
DOWN |
|
|
Novak,Ni. |
8.8 |
10.3 |
UP |
6.6 |
DOWN |
|
|
Santos,Ca. |
8.7 |
30.3 |
UP |
5.2 |
DOWN |
|
|