Draft Day | Player Projection
accuracy is Vital on Draft Day article by Anthony A. Perri
(Fantistics Founder and
Statistician)

Bigger doesn't necessarily mean better
when it comes to fantasy football..... and this expression
holds true when considering accuracy in player projections and
year end results.
If you are new to Fantistics,
please allow me to indulge you for a few minutes.
We differentiate our service by
basing our player prognostication on fundamental analysis. Our pre-season
projections formula takes over 15 indicators into account to
produce a base projection for each player stat category.
It has allowed us to enjoy an successful prognostication track record which has translated into results
for our
loyal community. What we do here is not by chance or gut
feel. I'm a numbers guy who relies on statistical probability
to make most of the decisions in my life. My eyes see a world
created using a perfect algorithm, an
algorithm that defines both
nature and our universe. In my universe, The Fantasy Universe,
I sheepishly try to apply the same logic.
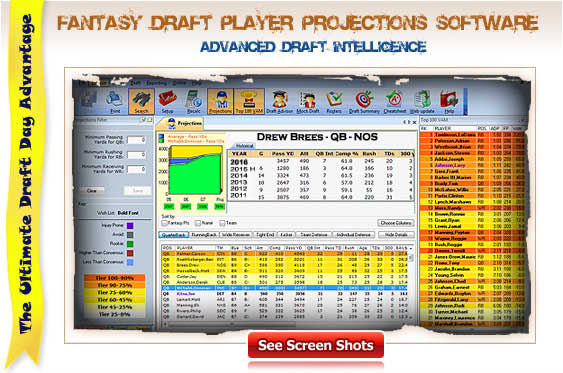
We fancy ourselves by providing
our subscribers with proven strategies, including the successful
VAM draft strategy.
A strategy that is time tested, not only through our 12 years of
service on the internet, but also through a historical simulation
model. We first introduced Value Above Mean (VAM or position
scarcity) to the draft day regiment in 1999, and have never
deviated from this model. Why should we! It's proven to be 20-30%
more effective than the typical drafting patterns. And this year
for the first time, subscribers can see the results for
themselves. The new Mock Draft Simulator
allows fantasy GMs to see the results of using our VAM
strategy verses computer opponents which utilize Average Draft
Position (ADP).
By season's end we usually have a good handle on how we performed with our fantasy player
projections. Through our year end survey we poll Subscribers
for their year end league placement. Using this, we can gauge how well our projections performed.
Another gauge we utilize is our success rate in correctly
forecasting player
production direction (progression or
digression).
One of the ways we measure
success is comparing what direction a player's performance
took during the forecasting season. We could sit here and tell
you that we predicted exactly how many TDs Malcom Floyd would
register in 2010 (6), but in essence projecting any exact number is pure
luck. On the other hand, predicting that Floyd's production would
rise in 2010 verses
his prior season....was not. Sure we considered age, supporting
cast, career indicators, the system, and durability factors...but
the key element that lead us to his upward projection was the
success that Floyd had the prior season in his completion
percentage and Red Zone success. Looking in from last preseason, our analysis indicated that
FLoyd's Red Zone production had been rising, which is resulting in
more red zone opportunities ...and true to expectation, he did
improve
in 2010.
2010: Preseason Projections vs Year End Results*
Quarterbacks:
23 out of
the top 30 = 77% correct
Running Backs:40 out of
top 50 = 80% correct
Wide Receivers:
48 out
of top 60 = 80% correct
Tight Ends:
20 out of
top 30 = 67% correct
Place Kickers:
22 out of the top 30 = 73% correct
*Based on predicting whether or not a
player would have a better or worse fantasy season. For a detailed
listing of each player and position. (2010/2009/2008/2007/2006/2005/2004/2003/2002
Forecasting Results.)