 Within the Numbers - RunningBacks Within the Numbers - RunningBacks |
 |
In our continuing series attempting to uncover what
we feel are the
most important statistical attributes among the various fantasy
positions, we look at Runningbacks in this report.
Runningbacks are easily the most valuable position in fantasy
football (based on the typical scoring league). There is an elite
class of running backs that score an immense amount of fantasy
points, and part of what makes this group more valuable is the
lack of value among replacements.
|
|
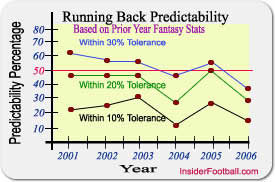
Runningbacks
offer more stability to the fantasy roster than the
quarterbacks. From a forecasting standard, last season was a
banner season, seeing 65% of the top 20 running backs produce
within 30% of the prior year's fantasy numbers.
The main reason
is the dependence factor, or should we say independence factor.
Running backs, with the exception of kickers, are the least
affected by outside influences. |
 |
|
However,
running backs have the dubious distinction of being the most
injury prone and given the amount of contact they must endure
during the season, it makes sense. This is part of the reason we recommend
taking as many Running backs as you can reasonably place on your reserve
roster.
Contrary to popular belief, forecasting Running backs by yards
per rush is not a very accurate predictor of future success. Our research indicates
that the RBs that accumulate multiple 100 yard games have a
high correlation to continuing success in succeeding seasons. Another
important indicator is schedule strength based on the opponents
Rushing Defense (this plays less a factor
with the Elite running backs).
According to our research, Running
backs are heavily affected by there schedule strength. Based
on our Schedule Strength Fantasy Formula that considers
yardage and TDs allowed, on average since 1960, there is a 75% probability
in predicting the "direction" of player performances
for the top 10 rushers and a 71% probability for the top 25. The
"direction" is defined as the deviation from a players
average weekly fantasy stats. In our Matchup Matrix
last season we predicted the weekly directional fantasy points for
78% of the top 10 running backs, and 72% of the top 25. As an
example last year RB LaDainian Tomlinson faced the Dolphins in week
12, and
as predicted in our weekly directional Matchup Matrix, he
was not able to produce his average weekly fantasy stats. Although
the directional guidance may sound non intuitive, the relative
severity of each match up is gauged on a scale of 2 to 10, with 10
being the most favorable match up.
Subscribers are privy to
our individual schedule strength matrix which covers every
player and is forecast for the entire player's season making
trading and lineup decisions a breeze.
The grid below arguably lists
the most relevant stats
attributed to Running backs: Projected 100 rushing yard games (100+)
and
projected total TDs.
Also included is Red Zone Touches
from 2002 (touches from within the opponents 20 yard line) and
Red Zone TD conversion rates (Touchdowns from the Red Zone
Touches). Highlighted in Blue are conversion rates that are
considered above average, highlighted in red are conversion rates
that are not considered favorable. NFL Teams tend to heavily weigh
these percentages when constructing plays within the red zone.
Thus knowing that Clinton Portis' success ratio within the redzone
was very favorable in 2002, would lead to the assumption that the
team will frequently utilize his services within the red zone in
2003.
The next sections consider the Schedule Strength
(based on a number of opponent factors including rushing yardage
allowed & rushing TD's allowed) that each player faced during the
last 2 years. PPG change (points per game) is the
difference in fantasy points per game (+/-) attained during the
2002 season verses the 2001 season. The reasoning behind this
calculation is to gauge how the player produced given a lighter or
heavier schedule. Players who faced an easier schedule and
produced less points per game during the season raises a red flag.
The last 3 columns represent the level of difficulty based on
each game's defensive unit that these RBs will face in 2003
(The figure listed is the number of games that we forecast either:
a Difficult, Neutral, or Easy game). An accumulation of
excessively "Difficult" games are highlighted in Red, while an
accumulation of excessively "Easy" games are highlighted in Blue.
Using this analysis we can presume the RBs that will have a good chance to match or exceed last season totals
and which face an uphill battle. As an example, Jamal Lewis'
schedule improves this season as he is only projected to face 4
difficult passing defenses this season. Last year, in this
analysis, we stated: "Edgerrin James faces an
extremely difficult season with only 3 "easy" and
7 "difficult" defensive opponents this season. Couple
this with the fact that he's coming off a difficult injury...it's
easy to sense that James has an uphill battle this season"...and we
were correct....Final Words: gauging the schedule difficulty is vital to
fantasy success.
The
listings are not necessarily in draft order.
|
|
|
2003 Projection |
2002 |
2002 |
|
|
Schedule Difficulty |
|
|
Player |
Tm |
100 yrd |
TD's |
Red Touch |
Red TD |
2001 |
2002 |
PPG^ |
2003 |
Hard |
Neutral |
Easy |
|
Williams, Ricky |
MIA |
9 |
18 |
75 |
17.3% |
A- |
C- |
6.6 |
B |
5 |
6 |
5 |
|
Tomlinson, LaDainian |
SDC |
8 |
16 |
59 |
22.0% |
A+ |
D |
5.4 |
B+ |
4 |
9 |
3 |
|
Portis, Clinton |
DEN |
8 |
16 |
51 |
27.5% |
N/A |
D+ |
N/A |
A+ |
3 |
7 |
6 |
|
McAllister, Deuce |
NOS |
9 |
18 |
57 |
24.6% |
A- |
B- |
15.1 |
D+ |
7 |
8 |
1 |
|
Holmes, Priest |
KCC |
9 |
15 |
66 |
31.8% |
C- |
C- |
9.3 |
A |
3 |
9 |
4 |
|
Faulk, Marshall |
STL |
6 |
14 |
38 |
26.3% |
A+ |
B- |
-9.4 |
A- |
4 |
7 |
5 |
|
Alexander, Shaun |
SEA |
5 |
17 |
59 |
23.7% |
B- |
B- |
0.6 |
B+ |
4 |
8 |
4 |
|
Lewis, Jamal |
BAL |
6 |
8 |
44 |
13.6% |
N/A |
D- |
N/A |
B+ |
4 |
8 |
4 |
|
Barber, Tiki |
NYG |
4 |
9 |
67 |
14.9% |
A- |
C |
4.5 |
C- |
7 |
6 |
3 |
|
Henry, Travis |
BUF |
6 |
13 |
65 |
16.9% |
A |
F |
7.3 |
C- |
7 |
6 |
3 |
|
Green, Ahman |
GBP |
6 |
10 |
47 |
14.9% |
B- |
B |
-1.0 |
B+ |
5 |
5 |
6 |
|
Garner, Charlie |
OAK |
3 |
10 |
44 |
13.6% |
C- |
D |
6.0 |
A+ |
2 |
9 |
5 |
|
James, Edgerrin |
IND |
5 |
8 |
39 |
7.7% |
A- |
D |
-6.4 |
B- |
5 |
8 |
3 |
|
Martin, Curtis |
NYJ |
5 |
8 |
41 |
17.1% |
A+ |
D |
-3.5 |
D+ |
8 |
4 |
4 |
|
George, Eddie |
TEN |
3 |
13 |
73 |
19.2% |
B |
D+ |
4.6 |
B+ |
4 |
9 |
3 |
|
Taylor, Fred |
JAC |
5 |
8 |
37 |
13.5% |
N/A |
F |
7.3 |
B |
5 |
7 |
4 |
|
Dillon, Corey |
CIN |
4 |
7 |
50 |
12.0% |
D- |
C- |
-1.8 |
A |
3 |
8 |
5 |
|
Staley, Duce |
PHI |
3 |
8 |
47 |
12.8% |
B- |
B |
1.5 |
D |
8 |
5 |
3 |
|
Green, William |
CLE |
3 |
8 |
23 |
17.4% |
N/A |
C- |
N/A |
A |
3 |
8 |
5 |
|
Stewart, James |
DET |
3 |
7 |
34 |
11.8% |
C+ |
B- |
2.7 |
A |
3 |
9 |
4 |
|
Dunn, Warrick |
ATL |
1 |
9 |
48 |
14.6% |
C- |
B+ |
1.8 |
D+ |
7 |
7 |
2 |
|
Canidate, Trung |
WAS |
2 |
8 |
3 |
0.0% |
A+ |
N/A |
-6.6 |
C- |
7 |
5 |
4 |
|
Smith, Antowain |
NEP |
2 |
8 |
52 |
13.5% |
A |
D- |
-2.7 |
D+ |
7 |
7 |
2 |
|
Hearst, Garrison |
SFO |
3 |
9 |
46 |
19.6% |
A- |
B+ |
-0.2 |
A |
3 |
8 |
5 |
|
Hambrick, Troy |
DAL |
1 |
6 |
7 |
14.3% |
B- |
B+ |
-1.8 |
D |
9 |
2 |
5 |
|
Davis, Stephen |
CAR |
3 |
9 |
35 |
22.9% |
C |
B- |
-0.1 |
C- |
7 |
5 |
4 |
|
Bettis, Jerome |
PIT |
3 |
11 |
29 |
24.1% |
B+ |
C- |
-1.8 |
B+ |
4 |
8 |
4 |
|
Barlow, Kevan |
SFO |
1 |
7 |
27 |
18.5% |
A- |
B+ |
0.9 |
A |
3 |
8 |
5 |
|
Mack, Stacey |
HOU |
1 |
13 |
29 |
31.0% |
D+ |
F |
-3.2 |
B |
5 |
7 |
4 |
|
Shipp, Marcel |
ARI |
2 |
6 |
36 |
19.4% |
N/A |
B- |
N/A |
A- |
3 |
10 |
3 |
|
Thomas, Anthony |
CHI |
2 |
7 |
30 |
20.0% |
A+ |
C |
-2.4 |
A |
4 |
5 |
7 |
|
Alstott, Mike |
TBB |
1 |
8 |
50 |
12.0% |
C- |
B+ |
-2.3 |
C |
6 |
8 |
2 |
|
Williams, Moe |
MIN |
0 |
9 |
35 |
31.4% |
C- |
B+ |
4.4 |
A- |
4 |
6 |
6 |
|
Smith, Onterrio |
MIN |
4 |
6 |
N/A |
N/A |
N/A |
N/A |
N/A |
A+ |
3 |
7 |
6 |
|
Smith, Emmitt |
ARI |
2 |
5 |
16 |
25.0% |
B- |
B+ |
-0.9 |
A- |
3 |
10 |
3 |
|
Zereoue, Amos |
PIT |
0 |
4 |
37 |
8.1% |
B+ |
C- |
2.9 |
B+ |
4 |
8 |
4 |
|
|
|
|
Join today for access to research and key indicators
to all the positions! Want
to see some samples of what Fantistics Football Subscribers will have access to this
season? click here... |
|


|
Copyright 2003 Fantistics Football, all
rights reserved
|
|
|